Dashboard and logs
Read server health and recorded player activity, inspect the separate server and game logs, and export the retained log entries.
The admin dashboard opens at /admin/. It puts server health and player
activity first. Every tile opens operations, an activity detail, or filtered logs.
The console requires a builder role for telemetry and logs.
Read the dashboard
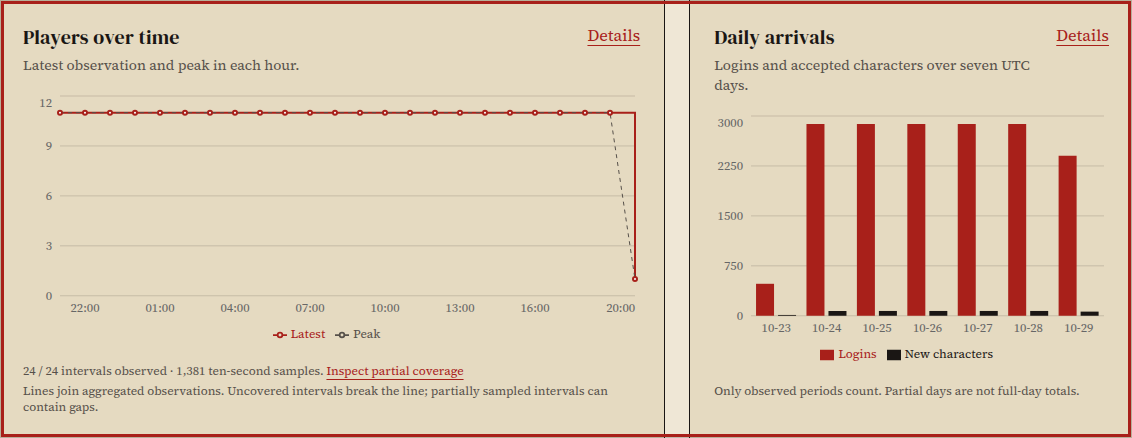
Section titled “Read the dashboard”Choose 24 hours or 7 days for online history and the count tiles. The online chart shows the latest observation and observed peak in each UTC hour or day. Daily arrivals always shows seven UTC days of logins and new characters. Activity detail includes charts for deaths, errors and warnings, plus a table with sample coverage. Dates and daily boundaries use UTC.
- Players online counts characters registered in the world, including bodies still present after a connection loss. Login screens aren't players online.
- Logins counts successful returning-character authentication, including authenticated duplicate/reconnect attempts. Guests and new characters are excluded. It isn't a count of unique people.
- New characters counts accepted character creation after persistence succeeds.
- Player deaths counts players, including death traps. Mob deaths don't count in this tile. Guest deaths use a generic Guest name.
- Errors and warnings count emitted structured server log records. Mudlog, the in-game staff activity log, uses OFF/BRF/NRM/CMP visibility types; those aren't severity levels.
- Uptime belongs to the current process. Current release comes from the running portable bundle manifest or available Go build metadata. Development executables identify themselves as development builds.
The server samples every ten seconds, stores minute buckets, and retains seven
days in DARKPAWNS_DATA_DIR/admin-history.json. This file is separate from player
saves. It's written once a minute and during normal context shutdown. An abrupt
termination can lose the latest minute. The chart assigns an event to the
observation interval ending at its next sample; the activity list keeps its event
time. Near an hour or midnight, the chart and list can place the same event in
neighboring buckets or dates.
A fresh installation has no historical data. Gaps aren't zeroes. Totals cover observed periods only; partial days don't imply full-day traffic. The detail table shows sampling coverage. A storage failure is visible on the dashboard. Preserve the history file across upgrades if you want continuity.
The last update time is recorded when a startup observes a changed executable identity. The first observation has no evidence of a previous update, so it shows unknown. Restarting the same executable doesn't count as an update. A build timestamp is never presented as a deployment timestamp.
Follow character activity
Section titled “Follow character activity”Open Logins, New characters or Player deaths to see the characters behind the count. Find a character by name, choose a time window, or use Older entries to page back. Each entry shows its time and class. Deaths also show the room and what killed the character: a mob name and vnum, another player, or a trap. If the game supplied no cause, the page says so.
Names of hidden staff follow your current immortal level. Counts can include activity whose names you can't see. Player killers are labeled Another player. The list saves character names and game details, with no addresses, credentials or chat. Guests don't count as returning-character sign-ins.
Details are saved for seven days, up to 20,000 entries. The page shows when this recording began. Older releases saved counts without names and included mobs in the death total; those totals aren't reused as player deaths. A full recorder can miss details while keeping the count. The page warns when entries were missed or removed at the limit. Totals can therefore exceed the visible list.
How it works
Section titled “How it works”Activity details and separate player-death counts share the existing history file and save schedule. Detail timestamps mark event time; count buckets mark the next sample. Normal shutdown samples once more before saving.
Inspect and export logs
Section titled “Inspect and export logs”Open Logs in the sidebar or /admin/operations/logs. The original server
tail remains in Operations. The log view refreshes server records every three
seconds. Mudlog uses its existing live SSE stream to trigger filtered snapshots,
with periodic refresh as recovery. Pause and resume affect live refresh.
Choose Server log or Mudlog, then filter messages and UTC time bounds. Server logs also filter by severity. Mudlog filters by syslog type, minimum immortal level ceiling and exact site key. A requested level can narrow access; it can't grant access above the caller's actual immortal level. Negative-level file-only mudlog events are excluded from the operator view and exports.
Raw .log downloads stored server lines or mudlog message text, followed by
newlines. Filtered CSV includes time,level,type,message. Both formats apply
the current filters on the server. CSV quotes embedded commas and newlines;
potential spreadsheet formulas receive a leading apostrophe. Raw message text
is unchanged.
Downloads cover the retained ring, up to 1,000 entries, rather than the full on-disk log archive. Live events can arrive between viewing and downloading. The mudlog observer reports dropped events; a nonzero count means the record is partial. Daily dashboard error counts can exceed the available error log lines because history outlives the log ring. No endpoint reads arbitrary server files.
Which log should I read?
Section titled “Which log should I read?”Server log shows startup, connections, storage and service errors. Mudlog shows in-game events recorded for staff, limited to your immortal level. They are separate sources, so the same lines need not appear in both.